
Designing a 3×3 vs 5×5 Risk Matrix
What Is a Risk Matrix?
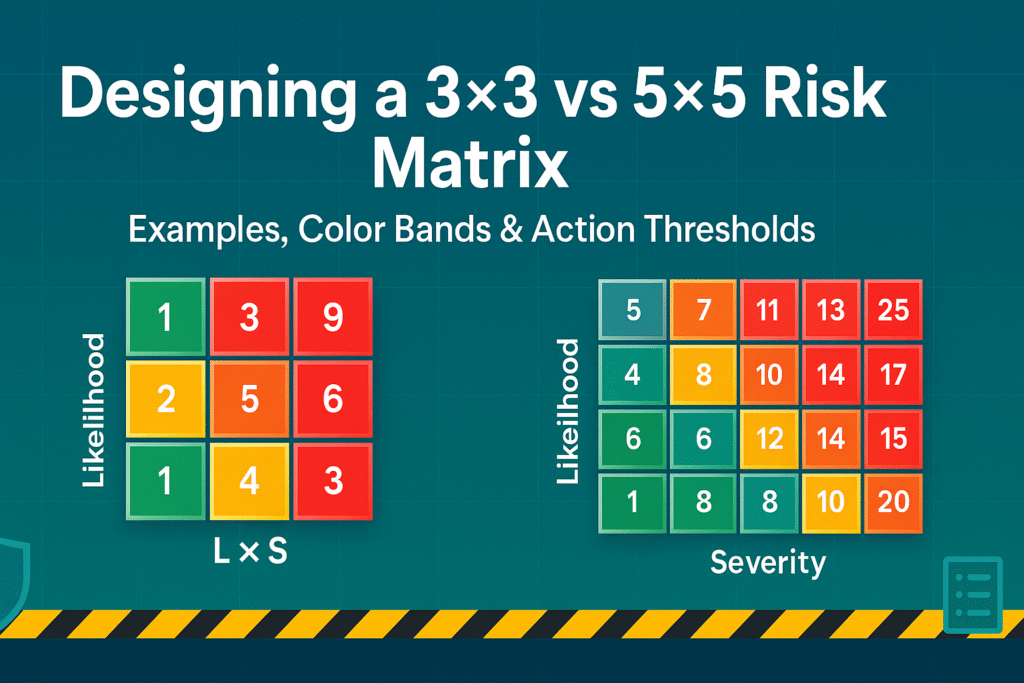
A risk matrix is a simple grid that helps you prioritize hazards by combining two things: Likelihood (how often it can happen) and Severity (how bad it will be). The product (Risk = L × S) places each hazard into color-coded bands—think green (okay), amber/yellow (watch/mitigate), red (stop & fix).
Why Organizations Rely on Risk Matrices
Because they’re fast, visual, and scalable. From construction sites to oil & gas, and from hospitals to IT change control, a matrix standardizes risk decisions so teams act consistently.
Where 3×3 and 5×5 Fit in Risk Management
- 3×3: small teams, repetitive tasks, quick toolbox talks, rapid approvals.
- 5×5: larger operations, complex variations, need for finer differentiation and auditability.
For broader context on risk principles, see ISO 31000 (Risk management — Guidelines) here: ISO 31000 overview.
Core Concepts You Must Lock In
Likelihood, Severity, and Risk = L × S
- Likelihood (L): probability or frequency band.
- Severity (S): worst credible harm (injury, asset damage, environmental, reputation).
- Risk Score: multiply L × S; interpret via bands (e.g., Low/Medium/High).
Ordinal Scales (And Why Not to Over-Quantify)
Both L and S are ordinal (ranked). Treat outputs as bands, not precise numbers. Use clear definitions and calibration sessions to avoid subjective drift.
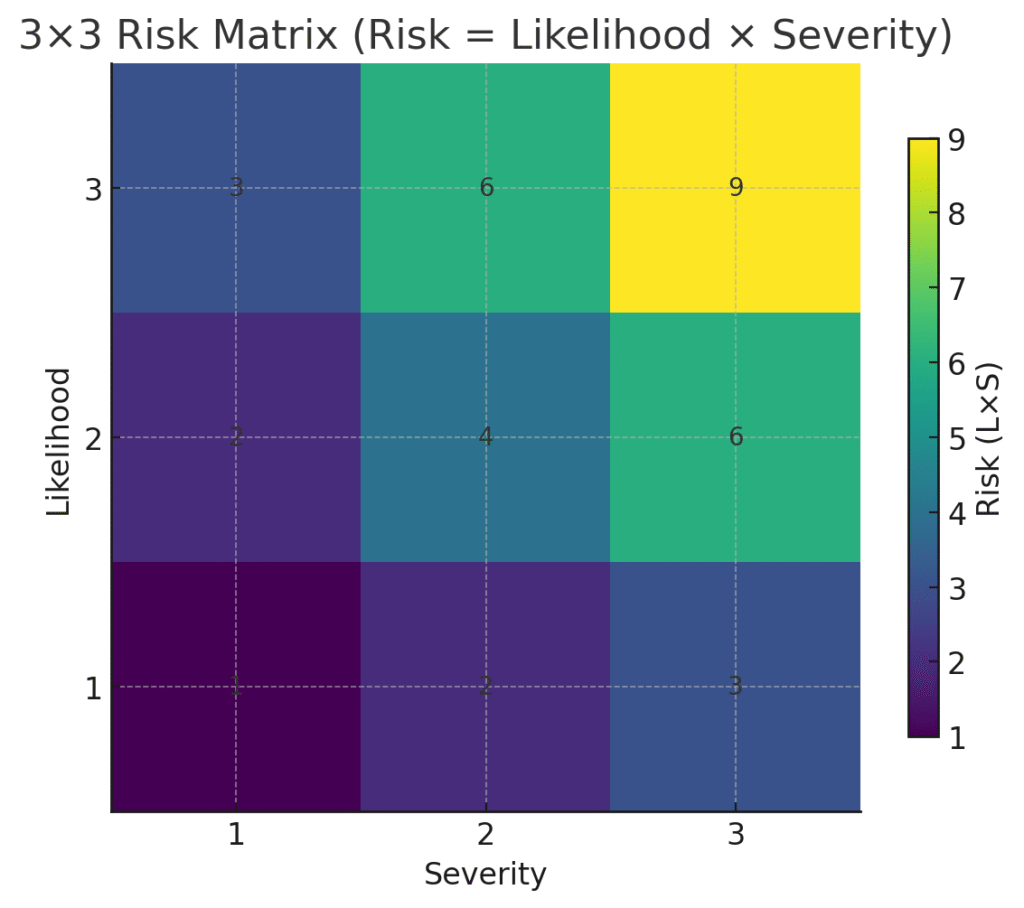
3×3 Risk Matrix: Simple, Fast, Effective
Scale Definitions (Likelihood & Severity)
Likelihood
1 = Unlikely (heard of elsewhere, not here; < once in 5 years)
2 = Possible (could happen; once every 1–5 years)
3 = Likely (seen here; annually or more)
Severity
1 = Minor (first aid only; negligible downtime)
2 = Serious (medical treatment; lost-time injury; moderate damage)
3 = Major (fatality/life-altering; severe damage; major breach)
Color Bands and Action Thresholds
- 1–2–3 = Low (Green) → Accept with routine controls
- 4–6 = Medium (Yellow/Amber) → Mitigate before proceeding or add supervision
- 7–9 = High (Red) → Stop work; escalate; redesign controls
Pros & Cons
Pros: lightning-fast, great for toolbox/shift briefings, minimal training.
Cons: coarse granularity; different risks may “tie,” making prioritization harder.
5×5 Risk Matrix: More Resolution, Finer Control
Scale Definitions (Likelihood & Severity)
Likelihood
1 = Rare (no known cases; < once in 10 years)
2 = Unlikely (heard of rarely; ~once in 5–10 years)
3 = Possible (could happen; every 1–5 years)
4 = Likely (seen in sector/site; yearly)
5 = Almost Certain (happens frequently; multiple times per year)
Severity
1 = Negligible (first aid; trivial cost)
2 = Minor (medical treatment; minor repairs)
3 = Moderate (LTI; significant repairs; reportable spill)
4 = Major (single fatality, permanent disability; major damage)
5 = Catastrophic (multi-fatality; complete asset loss; major environmental release)
Color Bands and Action Thresholds (Example)
- 1–4 = Low (Green)
- 5–9 = Moderate (Yellow)
- 10–16 = High (Amber/Orange)
- 17–25 = Extreme (Red)
(Tune thresholds to your risk appetite and legal framework.)
Pros & Cons
Pros: better discrimination, stronger audit trail, clearer escalation.
Cons: more training, risk of false precision if scales aren’t well defined.

Comparing 3×3 vs 5×5: Which One Should You Choose?
Decision Criteria (Team Maturity, Risk Appetite, Industry)
- Scope & Variety of Tasks: Complex/high-hazard → 5×5. Routine/low-variance → 3×3.
- Competency & Training: New teams → 3×3 (start simple), mature teams → 5×5.
- Regulatory & Client Demands: Some sectors expect 5×5 detail.
- Throughput Needs: If approvals must be very fast, 3×3 may win.
Mapping 5×5 Back to 3×3 (and Vice Versa)
- 5×5 → 3×3 (compression):
- Likelihood (1–2 → 1), (3 → 2), (4–5 → 3)
- Severity (1–2 → 1), (3 → 2), (4–5 → 3)
- 3×3 → 5×5 (expansion):
- Likelihood 1→(1–2), 2→(3), 3→(4–5)
- Severity 1→(1–2), 2→(3), 3→(4–5)
This mapping keeps risk categories broadly consistent across tools.
Designing Your Matrix Step-by-Step
Define Clear, Behavior-Anchored Scales
Avoid vague labels like “may happen.” Anchor each level with time-bound frequency (e.g., “seen here annually”) and consequence descriptors (e.g., “LTI, reportable spill”). Include people, asset, environment, reputation in severity notes if relevant.
Set Categories, Colors, and Decision Rules
- Decide bands (e.g., Low/Moderate/High/Extreme).
- Assign colors that are color-blind friendly (use patterns or labels too).
- Define what to do per band: permit requirements, sign-offs, PPE upgrades, isolation needs, stop-work triggers.
Build the Register and Workflows
Link your matrix to a risk register with fields like: Hazard, Scenario, L (pre), S (pre), Score (pre), Controls, L (post), S (post), Residual Score, Owner, Due Date, Status.
Worked Example #1 (3×3): Hot-Work in a Maintenance Bay
Scenario: Cutting brackets with an angle grinder near stored lubricants; typical daily activity.
Pre-Control Scoring (3×3):
- Likelihood (L): 3 = Likely (this task occurs frequently; sparks common)
- Severity (S): 3 = Major (credible fire/explosion; severe injury)
- Risk Score: 3 × 3 = 9 → High (Red)
Controls Planned:
- Hot-work permit, remove combustibles to 15 m or shield, fire watch, Class ABC extinguisher ready, gas test if in confined area, stop fans that spread sparks, non-sparking screens, full PPE (FR coveralls, gloves, visor), housekeeping & post-work fire watch (30–60 min).
Residual Risk (3×3):
- Likelihood: 2 = Possible (with screens, housekeeping, permit, fire watch)
- Severity: 2 = Serious (consequences reduced by separation & readiness)
- Residual Score: 2 × 2 = 4 → Medium (Amber)
Decision: Proceed with permit, supervisor sign-off, and strict fire watch.
Worked Example #2 (5×5): Working at Height on a Scaffold
Scenario: Installing pipe racks at 8 m height, busy deck below.
Pre-Control Scoring (5×5):
- Likelihood (L): 4 = Likely (activity repeated daily; multiple crew)
- Severity (S): 4 = Major (fall can be fatal; heavy objects overhead)
- Risk Score: 4 × 4 = 16 → High (Amber/Orange)
Controls Planned:
- Certified scaffold with green tag, mid-rails/toe-boards, double lanyard 100% tie-off with shock absorber, anchor points rated, exclusion zone below, tool lanyards, pre-use inspection, trained erectors, weather/wind checks, rescue plan with practiced drill, supervisor oversight.
Residual Risk (5×5):
- Likelihood: 2 = Unlikely (controls significantly lower exposure)
- Severity: 4 = Major (severity remains high if a fall occurs)
- Residual Score: 2 × 4 = 8 → Moderate (Yellow)
Decision: Proceed with permit to work, continue monitoring wind, enforce 100% tie-off and exclusion zone.
Risk Categories, Triggers, and ALARP
What “Acceptable,” “Tolerable,” and “Unacceptable” Mean
- Acceptable: Residual risk within green; handle via routine procedures.
- Tolerable: Yellow/Amber; reduce further if reasonably practicable (cost–benefit).
- Unacceptable: Red; do not proceed until risk is reduced.
Documenting “So Far As Is Reasonably Practicable”
Record alternatives considered, cost/effort, and why chosen controls are proportionate. This is essential for ALARP defensibility and regulatory audits.
Implementation Tips (Excel/Sheets, Tooling, Training)
Conditional Formatting & Data Validation
- Build dropdowns for L and S using your definitions.
- Compute
=L*Sfor score; color cells by band thresholds. - Lock definitions on a separate tab; link to all sheets to ensure consistency.
Version Control, Audit Trails, and Change Logs
- Stamp each matrix with a version and effective date.
- Keep an audit log for changes in scales or thresholds.
- Train users; run calibration workshops quarterly.
Common Pitfalls and How to Avoid Them
False Precision & Score Gaming
Avoid implying that 12 is “twice” as risky as 6. These are bands, not physics. Limit incentives to “game” scores (e.g., don’t set a hard approval cutoff that pushes people to under-score).
Ignoring Rare-But-Severe Events
Catastrophic but rare scenarios (e.g., confined-space asphyxiation) deserve special attention, even if multiplied scores seem moderate. Use bow-tie analysis or specific critical control verification.
When to Upgrade/Downgrade Your Matrix
From 3×3 → 5×5 for Complex Operations
Signals: frequent “ties,” many amber decisions needing finer resolution, client/regulator asks for more granularity.
From 5×5 → 3×3 to Speed Decisions
Signals: analysis paralysis, low adoption on the shop floor, excessive time per permit. Keep a 5×5 for engineering studies, but use 3×3 for frontline permits.
Calibration Workshops: Keeping Scores Consistent
Facilitated Scoring Sessions
Bring cross-functional teams. Score real jobs together. Discuss why a scenario is “Possible” vs “Likely.” Capture examples and codify them in the definitions.
Back-Testing Against Incidents
Review past incidents: Would your current matrix have flagged them as high enough? If not, tune definitions/thresholds and train again.
Template: Ready-to-Use Scale Definitions
3×3 Likelihood Definitions
| L | Title | Practical Anchor |
|---|---|---|
| 1 | Unlikely | Not seen here; < once in 5 years |
| 2 | Possible | Could happen; once every 1–5 years |
| 3 | Likely | Seen here; at least annually |
3×3 Severity Definitions
| S | Title | Practical Anchor |
|---|---|---|
| 1 | Minor | First aid; < 1 day downtime; small clean-up |
| 2 | Serious | Medical treatment or LTI; moderate repair cost; reportable near miss |
| 3 | Major | Single fatality/permanent disability; major asset damage; significant release |
3×3 Bands (example):
1–3 Low, 4–6 Medium, 7–9 High.
5×5 Likelihood Definitions
| L | Title | Practical Anchor |
|---|---|---|
| 1 | Rare | No known cases; < once in 10 years |
| 2 | Unlikely | Very infrequent; once in 5–10 years |
| 3 | Possible | Could occur; every 1–5 years |
| 4 | Likely | Occurs in sector/site; annually |
| 5 | Almost Certain | Happens frequently; multiple times per year |
5×5 Severity Definitions
| S | Title | Practical Anchor |
|---|---|---|
| 1 | Negligible | First aid only; trivial cost |
| 2 | Minor | Medical treatment; minor repair |
| 3 | Moderate | LTI; significant repair; moderate environmental effect |
| 4 | Major | Single fatality, life-altering injury; major asset damage; major environmental harm |
| 5 | Catastrophic | Multiple fatalities; complete asset loss; severe environmental disaster |
5×5 Bands (example):
1–4 Low, 5–9 Moderate, 10–16 High, 17–25 Extreme.
Conclusion & Next Steps
Designing a 3×3 vs 5×5 risk matrix is about fit: the mix of your hazards, team maturity, and the speed vs precision you need. Start with clear, behavior-anchored definitions, decide thresholds and actions, and integrate them into your permits, audits, and training. Use 3×3 when you need speed and simplicity; choose 5×5 when your environment demands finer discrimination and stronger auditability. Keep calibrating with workshops, back-testing against incidents, and refining ALARP justifications. The result? Decisions that are faster, clearer, and defensible—every single shift.
Gas Cylinder Handling JSA – Job Safety Analysis
Tower Crane Operation JSA – Job Safety Analysis
Forklift Operation JSA – Job Safety Analysis
Lockout/Tagout LOTO Procedures JSA – Job Safety Analysis
Site Housekeeping Activities JSA – Job Safety Analysis
FAQs
1) Is multiplying L × S statistically valid?
It’s a pragmatic heuristic on ordinal scales. Treat scores as bands for decisions, not exact math. Use additional analysis (e.g., bow-tie) for critical hazards.
2) How do I pick thresholds for color bands?
Start with common ranges (e.g., 5×5: 1–4, 5–9, 10–16, 17–25) and adjust after calibration workshops and incident back-testing to match your risk appetite.
3) Can I use different scales for environment vs people?
Yes. Many organizations assess People, Environment, Asset, Reputation separately and then take the worst case or apply weighted rules.
4) When should I switch from 3×3 to 5×5?
If you’re seeing frequent “ties,” complex jobs, or heavier regulatory/client oversight, upgrade to 5×5 for granularity and audit strength.
5) How do I ensure consistency across shifts and sites?
Provide behavior-anchored definitions, run regular calibration sessions, audit the risk register, and maintain a version-controlled matrix.
")


")


")


")
")
 Senior Manager Required for HPCL Rajasthan Refinery Limited: Salary up to 2,20,000 per month")
 The National Examination Board in Occupational Safety and Health")
 SOP Document")

